Heatwave Data Analysis Summer 2022
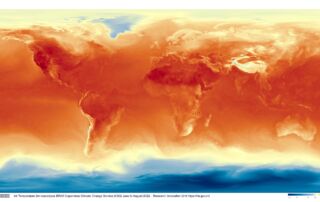
This EPSG:4326 – WGS 84 equirectangular projection (equidistant cylindrical projection) visualises the global air temperature at 2 meters altitude per hour from 01st June 2022 00:00 to 31st August 2022 23:00 Coordinated Universal Time (UTC). This scientific data visualisation forms part of the ongoing study by the Research Innovation Unit on the phenomena of [...]
